
If you have ever taken an algebra class, you probably learned about different variables like x, y and maybe even z. Some examples of variables include x = number of heads or y = number of cell phones or z = running time of movies. Thus, in basic math, a variable is an alphabetical character that represents an unknown number.
Well, in probability, we also have variables, but we refer to them as random variables. A random variable is a variable that is subject to randomness, which means it can take on different values.
As in basic math, variables represent something, and we can denote them with an x or a y or any other letter for that matter. But in statistics, it is normal to use an X to denote a random variable. The random variable takes on different values depending on the situation. Each value of the random variable has a probability or percentage associated with it.
Discrete Random Variables
Let’s see an example. We’ll start with tossing coins. I want to know how many heads I might get if I toss two coins. Since I only toss two coins, the number of heads I could get is zero, one, or two heads. So, I define X (my random variable) to be the number of heads that I could get.
In this case, each specific value of the random variable – X = 0, X = 1 and X = 2 – has a probability associated with it. When the variable represents isolated points on the number line, such as the one below with 0, 1 or 2, we call it a discrete random variable. A discrete random variable is a variable that represents numbers found by counting. For example: number of marbles in a jar, number of students present or number of heads when tossing two coins.
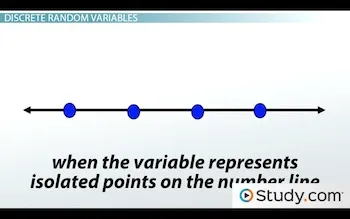 |
| Discrete random variables represent isolated points on the number line. |
X is discrete because the numbers that X represents are isolated points on the number line.
The number of heads that can come up when tossing two coins is a discrete random variable because heads can only come up a certain number of times: 0, 1 or 2. Also, we want to know the probability associated with each value of the random.
| # of Heads | Probability |
| 0 | 0.25 |
| 1 | 0.5 |
| 2 | 0.25 |
In the table, you will notice the probabilities. We will see how to calculate the probabilities associated with each value of the variable. However, what we see above is called a probability distribution for the number of heads (our random variable) when you toss two coins. A probability distribution has all the possible values of the random variable and the associated probabilities.
Continuous Random Variables
Let’s see another example.
Suppose I am interested in looking at statistics test scores from a certain college from a sample of 100 students. Well, the random variable would be the test scores, which could range from 0% (didn’t study at all) to 100% (excellent student). However, since test scores vary quite a bit and they may even have decimal places in their scores, I can’t possibly denote all the test scores using discrete numbers. So in this case, I use intervals of scores to denote the various values of my random variable.
When we have to use intervals for our random variable or all values in an interval are possible, we call it a continuous random variable. Thus, continuous random variables are random variables that are found from measuring – like the height of a group of people or distance traveled while grocery shopping or student test scores. In this case, X is continuous because X represents an infinite number of values on the number line.
Let’s look at a hypothetical table of the random variable X and the number of people who scored in those different intervals:
| Test Scores | Frequency(% of students) |
| 0 to <20% | 5 |
| 20% to <40% | 20 |
| 40% to <60% | 30 |
| 60% to <80% | 35 |
| 80% to 100% | 10 |
Since I know there are one hundred students in all, I could also have a column with relative frequency or percentage of students that scored in the different intervals. We calculate this by dividing each frequency by the total (in this case, 100). We then either leave the answer as a decimal or convert it to a percentage. Thus, like the coin example, the random variable (in this case, the intervals) would have certain probabilities or percentages associated with it. And this would be a probability distribution for the test scores.
| Test Scores | Relative Frequency |
| 0 to <20% | 5% |
| 20% to <40% | 20% |
| 40% to <60% | 30% |
| 60% to <80% | 35% |
| 80% to 100% | 10% |
Probabilities Range Between 0 and 1
In the study of probability, we are interested in finding the probabilities associated with each value of these random variables. You may notice that, as a decimal, no probability is ever greater than one, nor are they negative. This is always true. For any designation of the random variable, the probability is always between zero and one, never negative and never greater than one. In math books, you will see this written as:
 |
Which says that P(X) is always between 0 and 1.
The notation of P and then parentheses around X – P(X) – means the probability of X. Remember, X is the random variable. One note here: it does not matter if you use capital or common letters for the random variable or for P, as long as you are consistent!
Sum of Probabilities for a Distribution
Perhaps you noticed above that in each table the sum of all probabilities added up to 1 or 100%. However, for continuous random variables, we can construct a histogram of the table with relative frequencies, and the area under the histogram is also equal to 1.
 |