
A tragedy of statistics in most schools is how dull it’s made. Teachers spend hours wading through derivations, equations, and theorems, and, when you finally get to the best part — applying concepts to actual numbers — it’s with irrelevant, unimaginative examples like rolling dice. This is a shame as stats can be enjoyable if you skip the derivations (which you’ll likely never need) and focus on using the ideas to solve interesting problems.
In this article, we’ll cover Poisson Processes and the Poisson distribution, two important probability concepts. After highlighting only the relevant theory, we’ll work through a real-world example, showing equations and graphs to put the ideas in a proper context.
Poisson Process
A Poisson Process is a model for a series of discrete event where the average time between events is known, but the exact timing of events is random. The arrival of an event is independent of the event before (waiting time between events is memoryless). For example, suppose we own a website which our content delivery network (CDN) tells us goes down on average once per 60 days, but one failure doesn’t affect the probability of the next. All we know is the average time between failures. This is a Poisson process that looks like:
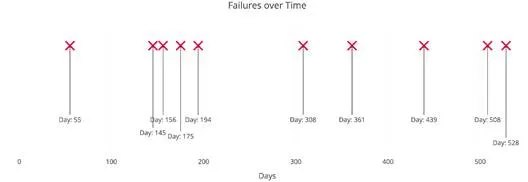
Example Poisson Process with average time between events of 60 days.
The important point is we know the average time between events but they are randomly spaced (stochastic). We might have back-to-back failures, but we could also go years between failures due to the randomness of the process.
A Poisson Process meets the following criteria (in reality many phenomena modeled as Poisson processes don’t meet these exactly):
1. Events are independent of each other. The occurrence of one event does not affect the probability another event will occur.
2. The average rate (events per time period) is constant.
3. Two events cannot occur at the same time.
The last point — events are not simultaneous — means we can think of each sub-interval of a Poisson process as a Bernoulli Trial, that is, either a success or a failure. With our website, the entire interval may be 600 days, but each sub-interval — one day — our website either goes down or it doesn’t.
Common examples of Poisson processes are customers calling a help center, visitors to a website, radioactive decay in atoms, photons arriving at a space telescope, and movements in a stock price. Poisson processes are generally associated with time, but they do not have to be. In the stock case, we might know the average movements per day (events per time), but we could also have a Poisson process for the number of trees in an acre (events per area).
(One instance frequently given for a Poisson Process is bus arrivals (or trains or now Ubers). However, this is not a true Poisson process because the arrivals are not independent of one another. Even for bus systems that do not run on time, whether or not one bus is late affects the arrival time of the next bus. Jake VanderPlas has a great article on applying a Poisson process to bus arrival times which works better with made-up data than real-world data.)
Poisson Distribution
The Poisson Process is the model we use for describing randomly occurring events and by itself, isn’t that useful. We need the Poisson Distribution to do interesting things like finding the probability of a number of events in a time period or finding the probability of waiting some time until the next event.
The Poisson Distribution probability mass function gives the probability of observing k events in a time period given the length of the period and the average events per time:
Poisson distribution for probability of k events in time period.
This is a little convoluted, and events/time * time period is usually simplified into a single parameter, λ, lambda, the rate parameter. With this substitution, the Poisson Distribution probability function now has one parameter:
Poisson distribution probability of k events in an interval.
Lambda can be thought of as the expected number of events in the interval. (We’ll switch to calling this an interval because remember, we don’t have to use a time period, we could use area or volume based on our Poisson process). I like to write out lambda to remind myself the rate parameter is a function of both the average events per time and the length of the time period but you’ll most commonly see it as directly above.
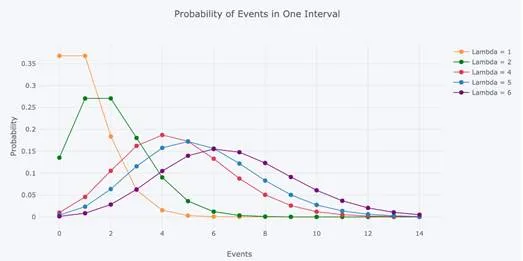
As we change the rate parameter, λ, we change the probability of seeing different numbers of events in one interval. The below graph is the probability mass function of the Poisson distribution showing the probability of a number of events occurring in an interval with different rate parameters.
Probability Mass function for Poisson Distribution with varying rate parameter.
The most likely number of events in the interval for each curve is the rate parameter. This makes sense because the rate parameter is the expected number of events in the interval and therefore when it’s an integer, the rate parameter will be the number of events with the greatest probability.
When it’s not an integer, the highest probability number of events will be the nearest integer to the rate parameter, since the Poisson distribution is only defined for a discrete number of events. The discrete nature of the Poisson distribution is also why this is a probability mass function and not a density function. (The rate parameter is also the mean and variance of the distribution, which do not need to be integers.)
We can use the Poisson Distribution mass function to find the probability of observing a number of events over an interval generated by a Poisson process. Another use of the mass function equation — as we’ll see later — is to find the probability of waiting some time between events.