
If everything were the same, we would have no need of statistics. But, people’s heights, ages, etc., do vary. We often need to measure the extent to which scores in a dataset differ from each other. Such a measure is called the dispersion of a distribution. This tutorial presents various measures of dispersion that describe how scores within the distribution differ from the distribution’s mean and median.
Range
The range is the simplest measure of dispersion. The range can be thought of in two ways.
- As a quantity: the difference between the highest and lowest scores in a distribution.
“The range of scores on the exam was 32.”
- As an interval; the lowest and highest scores may be reported as the range.
“The range was 62 to 94,” which would be written (62, 94).
The Range of a Distribution
Find the range in the following sets of data:
 | |
| NUMBER OF BROTHERS AND SISTERS{ 2, 3, 1, 1, 0, 5, 3, 1, 2, 7, 4, 0, 2, 1, 2,1, 6, 3, 2, 0, 0, 7, 4, 2, 1, 1, 2, 1, 3, 5, 12,4, 2, 0, 5, 3, 0, 2, 2, 1, 1, 8, 2, 1, 2 } |
An outlier is an extreme score, i.e., an infrequently occurring score at either tail of the distribution. Range is determined by the furthest outliers at either end of the distribution. Range is of limited use as a measure of dispersion, because it reflects information about extreme values but not necessarily about “typical” values. Only when the range is “narrow” (meaning that there are no outliers) does it tell us about typical values in the data.
Percentiles and related characteristics
Most students are familiar with the grading scale in which “C” is assigned to average scores, “B” to above-average scores, and so forth. When grading exams “on a curve,” instructors look to see how a particular score compares to the other scores. The letter grade given to an exam score is determined not by its relationship to just the high and low scores, but by its relative position among all the scores.
Percentile describes the relative location of points anywhere along the range of a distribution. A score that is at a certain percentile falls even with or above that percent of scores. The median score of a distribution is at the 50th percentile: It is the score at which 50% of other scores are below (or equal) and 50% are above. Commonly used percentile measures are named in terms of how they divide distributions. Quartiles divide scores into fourths, so that a score falling in the first quartile lies within the lowest 25% of scores, while a score in the fourth quartile is higher than at least 75% of the scores.
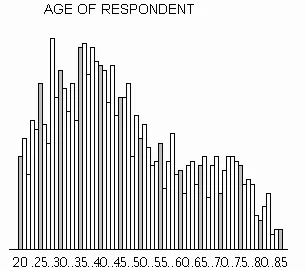
Quartile Finder
Find the quartile scores for the following distribution. (See instructions appearing below the histogram).
The divisions you have just performed illustrate quartile scores. Two other percentile scores commonly used to describe the dispersion in a distribution are decile and quintile scores which divide cases into equal sized subsets of tenths (10%) and fifths (20%), respectively. In theory, percentile scores divide a distribution into 100 equal sized groups. In practice this may not be possible because the number of cases may be under 100.
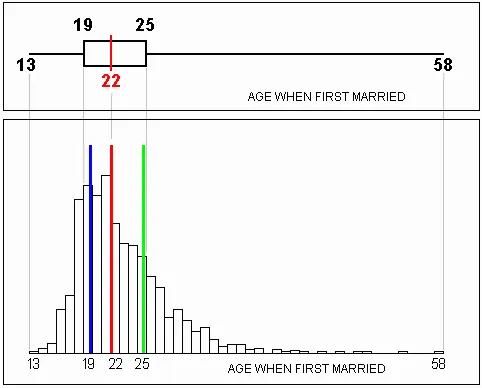
A box plot is an effective visual representation of both central tendency and dispersion. It simultaneously shows the 25th, 50th (median), and 75th percentile scores, along with the minimum and maximum scores. The “box” of the box plot shows the middle or “most typical” 50% of the values, while the “whiskers” of the box plot show the more extreme values. The length of the whiskers indicate visually how extreme the outliers are.
Below is the box plot for the distribution you just separated into quartiles. The boundaries of the box plot’s “box” line up with the columns for the quartile scores on the histogram. The box plot displays the median score and shows the range of the distribution as well.
Variance and Standard Deviation
By far the most commonly used measures of dispersion in the social sciences are variance and standard deviation. Variance is the average squared difference of scores from the mean score of a distribution. Standard deviation is the square root of the variance.
In calculating the variance of data points, we square the difference between each point and the mean because if we summed the differences directly, the result would always be zero. For example, suppose three friends work on campus and earn $5.50, $7.50, and $8 per hour, respectively. The mean of these values is $(5.50 + 7.50 + 8)/3 = $7 per hour. If we summed the differences of the mean from each wage, we would get (5.50-7) + (7.50-7) + (8-7) = -1.50 + .50 + 1 = 0. Instead, we square the terms to obtain a variance equal to 2.25 + .25 + 1 = 3.50. This figure is a measure of dispersion in the set of scores.
The variance is the minimum sum of squared differences of each score from any number. In other words, if we used any number other than the mean as the value from which each score is subtracted, the resulting sum of squared differences would be greater. (You can try it yourself — see if any number other than 7 can be plugged into the preceeding calculation and yield a sum of squared differences less than 3.50.)
The standard deviation is simply the square root of the variance. In some sense, taking the square root of the variance “undoes” the squaring of the differences that we did when we calculated the variance.
Variance and standard deviation of a population are designated by ![]() and
and ![]() , respectively. Variance and standard deviation of a sample are designated by s2 and s, respectively.
, respectively. Variance and standard deviation of a sample are designated by s2 and s, respectively.
| Variance | Standard Deviation | |
| Population | | 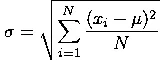 |
| Sample |  | 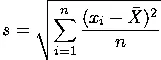 |
In these equations, ![]() is the population mean,
is the population mean, ![]() is the sample mean, N is the total number of scores in the population, and n is the number of scores in the sample.
is the sample mean, N is the total number of scores in the population, and n is the number of scores in the sample.
Computing Variance and Standard Deviation
This exercise shows you how to calculate variance and standard deviation for a data set. Click the button to calculate the variance and standard deviation, step by step, for the set of scores shown in the list. The mean of the scores has already been computed.